
Trusting a neighbor's off-hand comment or a quick Zillow glance to make one of the biggest financial decisions of your life is a gamble most people don't realize they're taking. In Colorado's fast-moving real estate market, the difference between a well-priced offer and a costly mistake often comes down to one thing: the quality of the data behind your decision. Whether you're buying your first home in Denver, selling a property in Colorado Springs, or evaluating tax assessments in Arapahoe County, concrete data gives you leverage that gut feeling simply cannot match.
Table of Contents
- The value of real estate data in Colorado
- How Colorado assessors use data for valuations
- Comparing methods: transactional vs. hedonic indices
- Turning data into smarter real estate decisions
- Why intuition alone is no match for hard data, our view
- Move forward with data-driven confidence
- Frequently asked questions
Key Takeaways
| Point | Details |
|---|---|
| Data reduces risk | Using robust valuation data helps buyers and sellers avoid costly mistakes. |
| Local trends matter | Colorado’s appraisal methods and market indices ensure fair value for all parties. |
| Choose the right index | Understanding the differences between transactional and hedonic indices reveals true market movement. |
| Platforms unify data | APIs and MLS can merge fragmented county data for a clear competitive edge. |
| Smart use boosts profit | Informed, data-driven choices can maximize rebates and minimize real estate costs. |
The value of real estate data in Colorado
Real estate data isn't just a spreadsheet of sold prices. In Colorado, it includes sales comparables (comps), pricing history, days on market, price per square foot trends, MLS-level insights, and time-adjusted valuations. Each of these data points tells a different part of the story about where the market is and where it's heading.
Most buyers and sellers still operate on incomplete information. They hear what a neighbor got for their house last spring, check a national average, or take an agent's word without digging deeper. The problem with that approach is real: data gaps expose you to serious valuation risk, and without unified platforms that aggregate comps and pricing history, over-pricing and under-pricing become easy traps to fall into.
Here's what strong real estate data actually includes:
- Sales comps: Recent sales of similar homes in the same zip code, adjusted for size, condition, and features
- Time-adjusted prices: Values corrected for market movement between the sale date and today
- Pricing history: How a specific property's list price has changed over time, revealing seller motivation
- MLS activity data: Days on market, list-to-sale price ratios, and inventory levels by neighborhood
- Assessment records: County-level valuations used to determine property taxes
Without access to all of these layers, you're making decisions with one hand tied behind your back. A seller who only checks recent neighborhood sales without adjusting for time might price their home $30,000 too low in a rising market. A buyer who ignores pricing history might not realize a home sat on the market for 90 days before the price dropped, which is powerful negotiation leverage.
"Unified platforms that pull together pricing history and comparable sales give buyers and sellers the kind of precise, actionable picture that protects them from costly pricing errors and lost negotiation leverage."
Pro Tip: Before you list or make an offer, pull at least 6 months of neighborhood sales data, not just the three most recent comps your agent shows you. More data points mean more accurate baselines.
How Colorado assessors use data for valuations
With a sense of why data matters broadly, it helps to see exactly how professionals in Colorado apply it. The state's property tax assessment process is one of the most rigorous examples of data-driven valuation in practice, and understanding it can benefit both buyers and sellers in concrete ways.

Colorado assessors rely on a methodology called Time Adjusted Sales Prices (TASP), which involves monthly median sales ratio analysis across 24 months of transaction data, adjusted to a specific appraisal date. For the 2025/2026 cycle, that date is June 30, 2024. This means every valuation appeal in the current cycle is anchored to market conditions as they existed on that specific date.
Here's how the TASP process works step by step:
- Data collection: Assessors gather all arm's-length sales (genuine market transactions) in a county over a 24-month window.
- Ratio analysis: Each sale is compared to its assessed value to identify whether assessments are tracking the market.
- Trend identification: Monthly median sales ratios reveal whether values are rising, falling, or flat over time.
- Time adjustment: Each sale is mathematically adjusted to reflect what it would have sold for on the appraisal date (June 30, 2024), accounting for market movement.
- Valuation modeling: These adjusted sales are then used to build the comp framework for individual property valuations.
| Assessment step | Data used | Purpose |
|---|---|---|
| Sales collection | 24 months of transactions | Establish broad market baseline |
| Ratio analysis | Assessment vs. sale price | Identify pricing accuracy |
| Trend analysis | Monthly median ratios | Detect market movement |
| Time adjustment | Market trend data | Normalize all sales to appraisal date |
| Final valuation | Adjusted comps | Set fair assessed value |
Why does this matter for you as a buyer or seller? If you're appealing a property tax assessment, understanding TASP means you can present your own adjusted comparable sales to counter the assessor's model. If you're buying, knowing that an assessed value reflects June 2024 conditions gives you context for interpreting the gap between assessed and list price. In a rising market, list prices move faster than assessments, which can create a misleading picture of value if you don't understand the lag.
Key fact: A home assessed at $480,000 for the 2025/2026 tax cycle was valued based on market data from before June 30, 2024. If the neighborhood has appreciated since then, the current market value could be significantly higher, a distinction that matters when you're deciding how much to offer.
Comparing methods: transactional vs. hedonic indices
Understanding local valuation practices leads naturally to how broader market data is interpreted, especially through the two most widely used pricing models: transactional indices and hedonic indices.
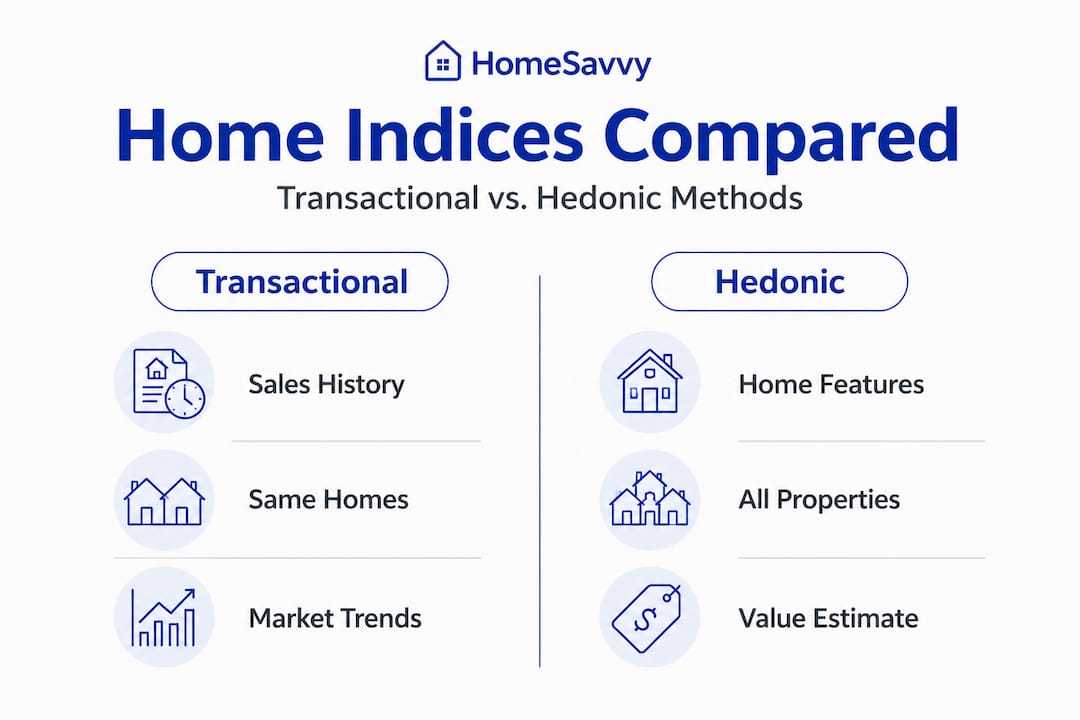
These two approaches answer slightly different questions about the market, and knowing which one you're looking at can change how you interpret price trend reports.
Transactional indices (like the Case-Shiller Home Price Index) measure price changes by tracking the same properties across multiple sales over time. They're powerful because they control for property-specific differences, but they're also more volatile. When transaction volume is high, such as in a seller's market, these indices can spike sharply because they capture intense buyer competition in real time.
Hedonic indices (like Zillow's ZHVI) estimate value based on property characteristics, including square footage, number of bedrooms, lot size, location, and features. Because they model willingness-to-pay based on attributes rather than raw transaction prices, they tend to be smoother and less volatile. Hedonic vs. repeat-sales indices differ meaningfully in their volatility: transactional indices spike harder in hot markets, while hedonic indices better reflect stable underlying demand.
| Index type | Example | Methodology | Volatility | Best use |
|---|---|---|---|---|
| Transactional (repeat-sales) | Case-Shiller | Tracks same-property resales | Higher | Hot market trend detection |
| Hedonic | Zillow ZHVI | Models value by characteristics | Lower | Stable baseline comparisons |
Here's why this matters practically:
- If you see Case-Shiller spike in a Colorado metro area, that signals intense transaction activity, not just rising prices. It could mean competition is compressing timelines and buyers are waiving contingencies.
- If the ZHVI is rising steadily but Case-Shiller is flat, it could indicate that higher-quality homes are driving perceived appreciation without broad market strength.
- When both indices rise together, that's the strongest signal of genuine, broad-based market appreciation.
Pro Tip: When researching a Colorado neighborhood, check both index types. If they diverge significantly, investigate why before making a pricing decision. A market where only one index is rising may be sending a misleading signal.
Understanding these indices isn't academic. It directly informs whether you price aggressively, wait for inventory to shift, or negotiate harder on a specific property.
Turning data into smarter real estate decisions
Once you understand the data and models, the real power lies in turning insight into financial advantage. Here's a practical framework for making your next Colorado real estate decision data-driven from start to finish.
Step-by-step checklist for data-driven buying or selling:
- Gather your comps properly. Pull at least 12 to 18 months of sales in your target neighborhood, not just the last 90 days. This gives you a trend, not just a snapshot.
- Time-adjust your comparables. If a comp sold 8 months ago, factor in the market's movement since then. A flat or declining market requires a downward adjustment; a rising market means that comp understates current value.
- Check both index types. Pull the local ZHVI trend and cross-reference it with any available Case-Shiller metro data. Note whether they align or diverge.
- Review the pricing history. How long has the property been on the market? Has the price dropped? How many times? This data reveals negotiation room and seller motivation.
- Look at assessment vs. market price. If the assessed value is significantly below the list price, find out when the assessment was last updated. It could indicate either a bargain or an overpriced listing.
- Evaluate list-to-sale price ratios. In competitive sub-markets, homes regularly sell above list. In slower areas, sellers routinely accept 2 to 5 percent below. Knowing the ratio in your target zip code helps you calibrate offers.
- Use unified MLS and platform data. Fragmented county data still hinders access in parts of Colorado, but modern MLS platforms and APIs aggregate this information in one place, giving you a data-driven edge over buyers still relying on intuition alone.
The rebate opportunity: One underused advantage of data literacy is knowing when you have negotiation leverage to push for price reductions or seller concessions. In Colorado, buyers working with platforms that offer commission rebates can often combine negotiation-driven price reductions with structured rebates for thousands of dollars in total savings. That combination only works when you walk in knowing the data.
Statistic to keep in mind: Buyers who use data to negotiate even a 1.5 percent price reduction on a $600,000 Colorado home save $9,000 before rebates are even factored in. Multiply that by a buyer's commission rebate and the savings become substantial.
Why intuition alone is no match for hard data, our view
We've worked with enough Colorado buyers and sellers to say this plainly: the people who lose money in real estate almost always made their biggest decisions on feel rather than fact.
A buyer in Jefferson County once passed on a full data review because their agent seemed confident. They offered $25,000 over the last comparable sale without realizing the market had actually softened 4 percent in the prior quarter. The offer was accepted immediately, which should have been a signal. They overpaid by a meaningful margin that a simple time-adjusted comp analysis would have caught.
On the other side, sellers who lean entirely on their agent's "pricing instinct" without looking at list-to-sale ratios and days-on-market trends frequently over-price, sit on the market too long, and end up accepting less than a correctly priced listing would have generated.
The Colorado market rewards those with information. Transactional indices spike in hot seller markets when transaction volume surges, and hedonic indices stay smoother, revealing the underlying demand picture. When you can read both, you understand whether urgency is real or manufactured. That distinction is worth thousands.
The contrarian truth here is that experience and intuition do matter, but only when paired with current, unified data. An experienced agent who also understands how to read TASP-adjusted comps, cross-reference index types, and pull accurate MLS trends is exponentially more valuable than one relying on feel alone. We believe the best real estate decisions in Colorado will increasingly be made by people who treat data as their primary tool and experience as the lens through which they interpret it.
Move forward with data-driven confidence
Knowing what the data says and knowing how to act on it are two different things. That's exactly the gap that HomeSavvy Colorado is built to close.
HomeSavvy combines AI-powered property insights with full-service agent support so Colorado buyers and sellers get the best of both worlds: real-time data tools that surface accurate valuations, neighborhood trends, and pricing history, plus expert guidance to turn those insights into action. Buyers access significant commission rebates, and sellers benefit from reduced listing fees, all backed by the kind of data infrastructure this article describes. If you're ready to stop guessing and start making decisions with a Colorado discount realtor rebate and a data-backed strategy in your corner, HomeSavvy is the place to start.
Frequently asked questions
What is the TASP method and how does it affect Colorado home values?
TASP stands for Time Adjusted Sales Price, and Colorado assessors use it to determine fair home values by adjusting past sales to a current appraisal date based on 24 months of market data. For the 2025/2026 cycle, that appraisal date is June 30, 2024.
Why should I trust data over a real estate agent's intuition?
Data pulls from thousands of transactions and removes bias, while intuition is limited to one person's experience and can miss key market shifts. Unified platforms that aggregate comps and pricing history protect you from the over-pricing and under-pricing that data gaps create.
How can I access unified Colorado real estate data as a homebuyer?
Modern MLS platforms and APIs now aggregate fragmented county data into a single, complete view of the market, giving buyers and sellers a reliable, current baseline for every decision.
What is the difference between transactional and hedonic indices in real estate?
Transactional indices like Case-Shiller track repeat sales of the same properties and are more volatile, while hedonic indices like Zillow's ZHVI model value based on property characteristics and provide a smoother, more stable trend line.